12 min read
HikariCP Pool Sizing for Postgres: Why Smaller Is Faster
How Postgres handles connections, why fewer of them run faster, and how to size HikariCP pools across many instances without exhausting max_connections.
- postgresql
- hikaricp
- connection-pooling
- spring-boot
- system-design
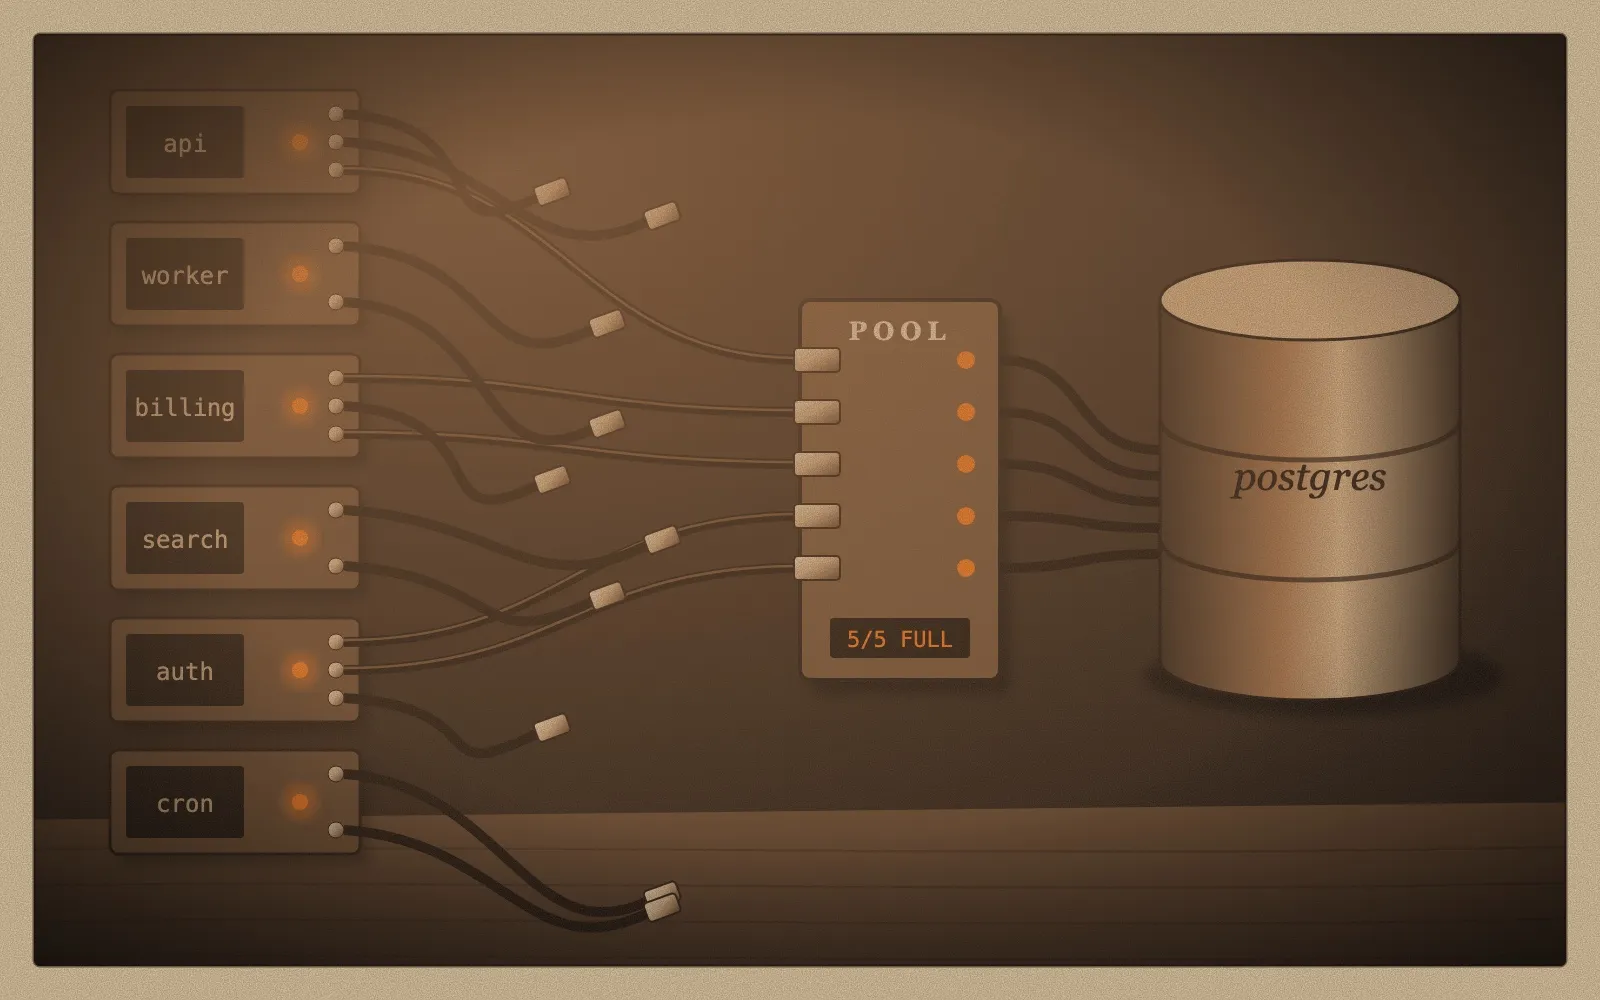
Table of contents
Every app that stores data has to connect to Postgres somehow. It looks like a simple thing to decide. And it is, as long as you are running just one copy of your app.
Run a few more copies and this one small number, your connection pool size, quietly becomes the thing that decides if your database stays up or not.
This is how you get to know:
FATAL: sorry, too many clients already
Nothing is broken here. No connection leak, no bad query. Every service is doing exactly what you told it to do. It is just simple maths that nobody did.
So let us see where this is coming from, and how to size your HikariCP pool so you never hit this.
What Postgres Does When You Open a Connection
In PostgreSQL, one connection means one full operating system process.
No thread pool here. No event loop handling thousands of clients with a few workers. Your app opens a socket, a process called the postmaster checks who you are, and then it calls fork() to create a brand new process just for you. This new process is called a backend. It runs your queries and stays alive till you disconnect.
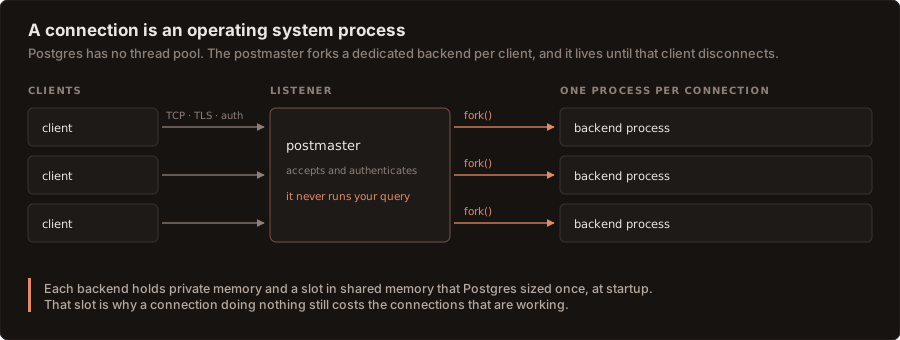
Postgres is known for its stability, and this design is exactly why. But it is also why one connection is not cheap. Every backend keeps its own private memory, takes a slot in shared memory that was fixed when the server started, and builds its own cache while running. Nothing here is shared. And nothing gets cheaper when you add more.
Why Opening a Postgres Connection Is Expensive
Opening a connection is not one single step. First a TCP handshake, then a TLS handshake, then authentication, then the fork, and then the new backend has to set up its session before it can do anything useful.
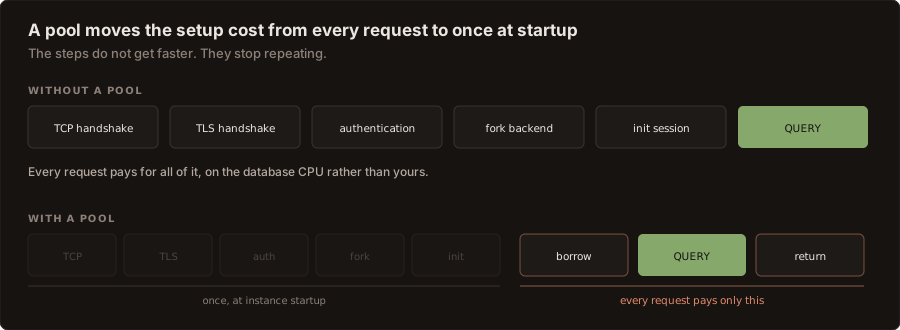
Without a pool, your app runs this whole sequence for every single request. And it runs it on the database CPU, not on its own. With a pool, it runs once, when your instance starts.
That is the whole point. These steps never become faster. They just stop repeating.
A Connection Pool Is a Queue, Not a Cache
Your app has hundreds of request threads. Your database can only run a small number of backends at once. The pool is what sits between these two.
It opens a fixed number of connections at startup, keeps them open, and lends them out. A thread borrows one, runs its query, and gives it back, usually within a few milliseconds. The socket never closes and the backend is never forked again.
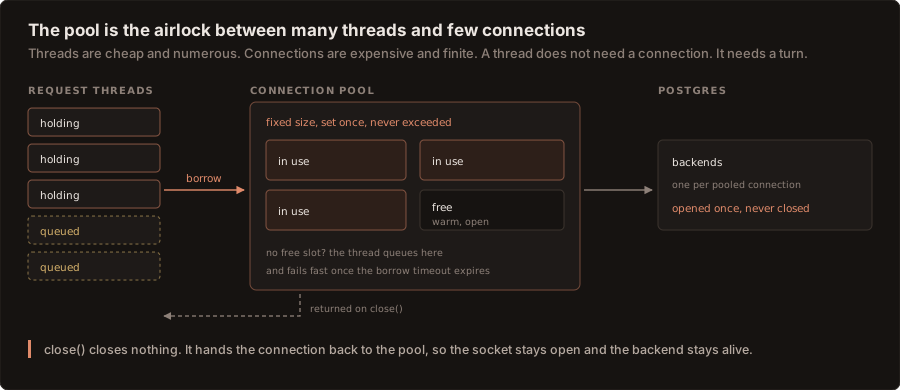
Here is the part that surprises most people. close() does not close anything. The pool gives your code a proxy, and closing that proxy just returns the real connection back to the pool. Your code still follows the same open, use, close pattern, but nothing underneath is actually opening or closing.
HikariCP is the JDBC pool that does all this on the JVM. It has been the Spring Boot default since 2.0. So if you never configured a pool, you are already using it.
The important thing here is not that HikariCP is fast. It is that it is a bounded queue sitting in front of a limited resource. Your pool size is a hard ceiling on how much work one instance can ask from the database at any moment, no matter how many threads are waiting behind it.
Why Fewer Connections Run Faster
This is the part that feels completely wrong when you first hear it. When traffic grows, increasing the pool size feels like the natural first move, and most of us do exactly that. But the measurements say the opposite. The HikariCP maintainers point to an Oracle demo where they only reduced the pool size, changed nothing else, and response times dropped from around 100ms to around 2ms.
Once you break it down, the reason is quite simple.
One CPU core runs one thread at a time. Give it more threads than it has cores and it will not run them together. It takes turns, and every turn costs you a context switch. Two tasks running one after another on a single core will always finish faster than the same two tasks switching back and forth.
So if a query was pure computation, your ideal pool size would be close to the core count. Anything beyond that is just waste.
But queries are not pure computation. They wait. They wait for the disk to find a page, and for the network to carry the result back. And while a query is waiting, its core is sitting idle and free. That idle time is the only reason your pool is ever bigger than the core count. Extra connections are there just to fill the gaps that waiting leaves behind.
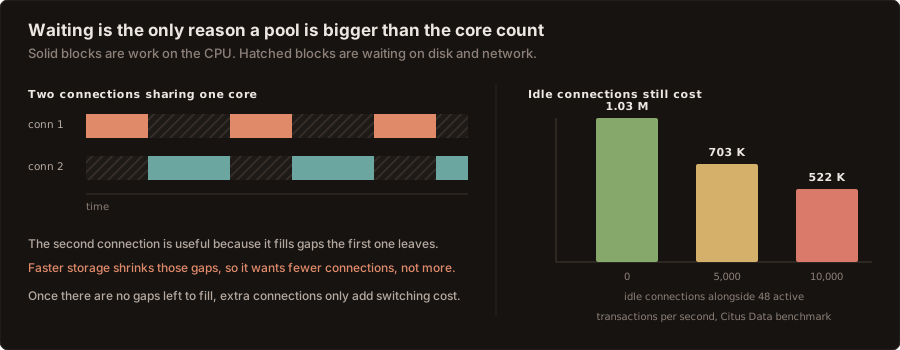
And this is where a very common assumption goes backwards. Faster storage does not mean you can have a bigger pool. NVMe leaves smaller gaps, so there is less to fill, so fewer connections work better. The HikariCP pool sizing guide says this clearly:
Don’t be tricked into thinking, “SSDs are faster and therefore I can have more threads”.
Idle connections are also not free. Postgres builds a visibility snapshot for every transaction, and to do that it walks through a list of every backend on the server, including the idle ones. Andres Freund measured this at Citus. He kept the active workload steady at 48 connections and only changed the number of idle connections sitting next to them. Throughput dropped from around 1.03 million transactions per second with no idle connections, to 703,000 with 5,000 idle, to 522,000 with 10,000. Postgres 14 improved this a lot with snapshot caching, so anything from 14 onwards handles it much better. But the direction never changes. An idle connection is not a free connection.
How to Size a HikariCP Connection Pool
Two calculations give you the range to work within.
The first one comes from queueing theory. The connections you need are your arrival rate multiplied by how long each request holds a connection:
connections = requests_per_second × seconds_held_per_request

1,000 requests/sec × 4 ms held = 4 connections
Four sounds far too small. But it is not, because a request never consumes a connection. It holds the connection for a few milliseconds and then frees it again. Four connections can handle a thousand requests per second because each one gets used two hundred and fifty times within that second.
The second one is the starting formula HikariCP gives you for the upper bound:
connections = (core_count × 2) + effective_spindle_count
Two parts of this formula get misread very often. core_count means your database server’s cores, not your application server’s cores. And effective_spindle_count is not the number of disks you have. HikariCP defines it as zero when your working set is fully cached, and it goes up towards the actual spindle count as your cache hit rate drops. So it is really measuring how often you are actually touching the disk.
The guide is also honest about where this formula stops working:
There hasn’t been any analysis so far regarding how well the formula works with SSDs.
So use it as a sanity check and let your own measurements decide the rest. One thing stays true no matter what storage you have. Size your pool for what the database can actually handle at once, not for what your application wants to ask for. Or as the same guide puts it:
You want a small pool, saturated with threads waiting for connections.
A small pool with a queue behind it, instead of a large pool where every thread immediately gets a connection. That queue is what stops your application from asking for more parallelism than what actually exists.
Pool Size Multiplies With Every Instance
Everything till now assumes you are running a single instance of your application. Run a few more and this assumption quietly stops working.
Every instance carries its own pool. Pools do not get shared across instances, and nothing is adding them up for you. Postgres cannot tell the difference between one instance holding thirty connections and thirty instances holding one connection each. It only counts sockets.
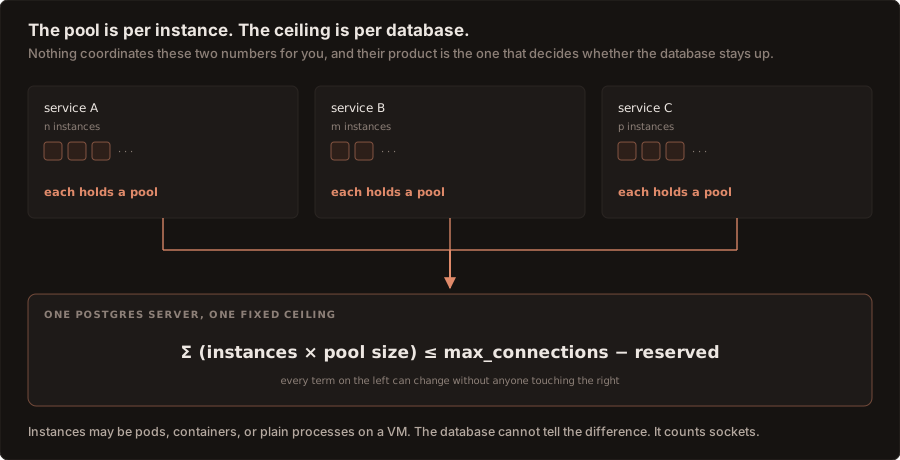
Every term on the left side belongs to some application team and keeps changing freely. The term on the right side belongs to whoever runs the database, and it rarely changes at all. Nothing in your system is checking this inequality. Either somebody sat down and worked it out, or it stops holding one day and you find out in the middle of a deploy.
Two things come out of this. First, your pool sizes should not be the same across the whole fleet. A nightly report job does not need what a checkout API needs, and giving it the same pool is just wasting capacity. Second, if your platform scales instances automatically, do this calculation against the maximum instance count. That is a number your platform will reach on its own, without asking you.
Budgeting Postgres max_connections
max_connections is a budget for your entire server. Everything that opens a client connection spends from it, not just your services.
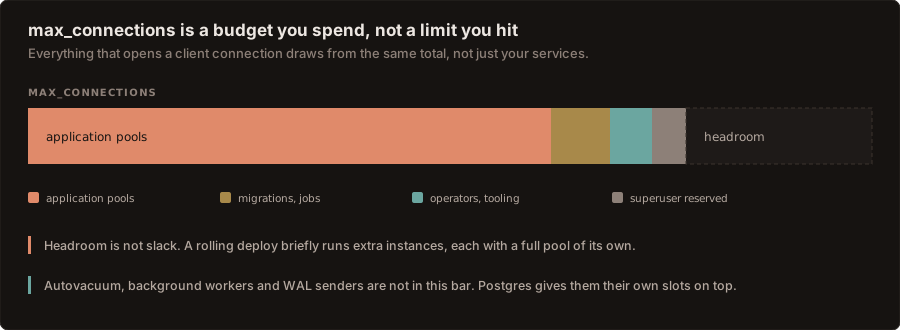
Three things here are easy to get wrong.
Headroom is not spare capacity. Headroom is your deploys. A rolling update runs extra instances for a short time, and each one carries a full pool. If your budget has no room for that overlap, then your deployment becomes the thing that takes the database down.
Autovacuum and replication are not part of this budget at all. Postgres gives autovacuum workers, background workers and WAL senders their own slots on top of max_connections. They do cost you memory, but they never compete for client slots. So subtracting them only means you gave your services less room than what you actually had.
Reserved superuser slots are better left untouched. Those slots are what let you connect and fix things while everything else is getting refused.
There is one guardrail here that is worth more than this whole section. Postgres can cap connections per role. So putting a limit on each service’s database user turns one badly configured pool into one service’s problem, instead of everyone’s problem. And it takes just a single statement.
HikariCP vs PgBouncer: Where Each One Fits
This is usually the next question, and for most setups the answer is that you do not need it.
These two are not alternatives to each other. HikariCP sits inside your application and pools connections for that one instance. PgBouncer is a proxy sitting in front of the database, and it multiplexes many client connections onto far fewer server connections. Even if you run the proxy, you will still want a pool inside your application behind it.
For me the line is about predictability, not scale. If your instance count is stable enough that a fixed budget holds, then a pool inside your application is enough. Adding a proxy only gives you one more hop, one more process, and one more failure mode that you did not have before. But once that instance count becomes truly unpredictable, either through autoscaling or through many teams sharing one database, the proxy becomes the only place where you can actually enforce the ceiling.
What PgBouncer will not do is fix a badly sized pool. It just hides it very convincingly, for some time.
The Shape of the Problem
Nobody ever picks the number that breaks the database.
The default pool size is fine for one application. The default max_connections is fine for a database that does not know what is coming. Running a few instances is fine for availability. Every one of these choices is reasonable on its own. It is the three of them multiplied together that fails.
And this is what makes it a system design problem, not a tuning problem. The number that actually matters is the total connections across your whole fleet, and this number does not live in any config file. It comes from decisions taken by different people at different times, multiplied by an instance count that moves on its own.
So your job is to work out that number and keep it visible. Size each pool from what your database can actually handle, redo the calculation whenever your services or instance counts change, and put a per role cap underneath so that one mistake stops at one service.
The part that took me the longest to accept is that the right pool size is much smaller than it feels. A small pool with a queue behind it is faster than a large one, and much easier to reason about.
If you go and check your own pool settings after reading this, I would really like to know what you found. Especially if that number turned out to be a default that nobody ever chose.